
Pattern-based Data Mart
Use this option when your data is spread across multiple similarly named tables, such as daily partitions (e.g., events_20250731, events_20250801, etc.).
A pattern-based Data Mart lets you query all of these tables as a unified dataset using a wildcard — without manually listing each one.
Note: You need a data storage available for the data mart setup. Here is how to add a data storage
Patterns Examples
Section titled “Patterns Examples”This is commonly used with:
- GA4 BigQuery export tables →
events_* - GA4 export for 2025 →
events_2025* - Time-based tables by date or month → e.g.
ads_202507*,clicks_202503* - Any system that creates one table per day
Step 1: Create a New Data Mart
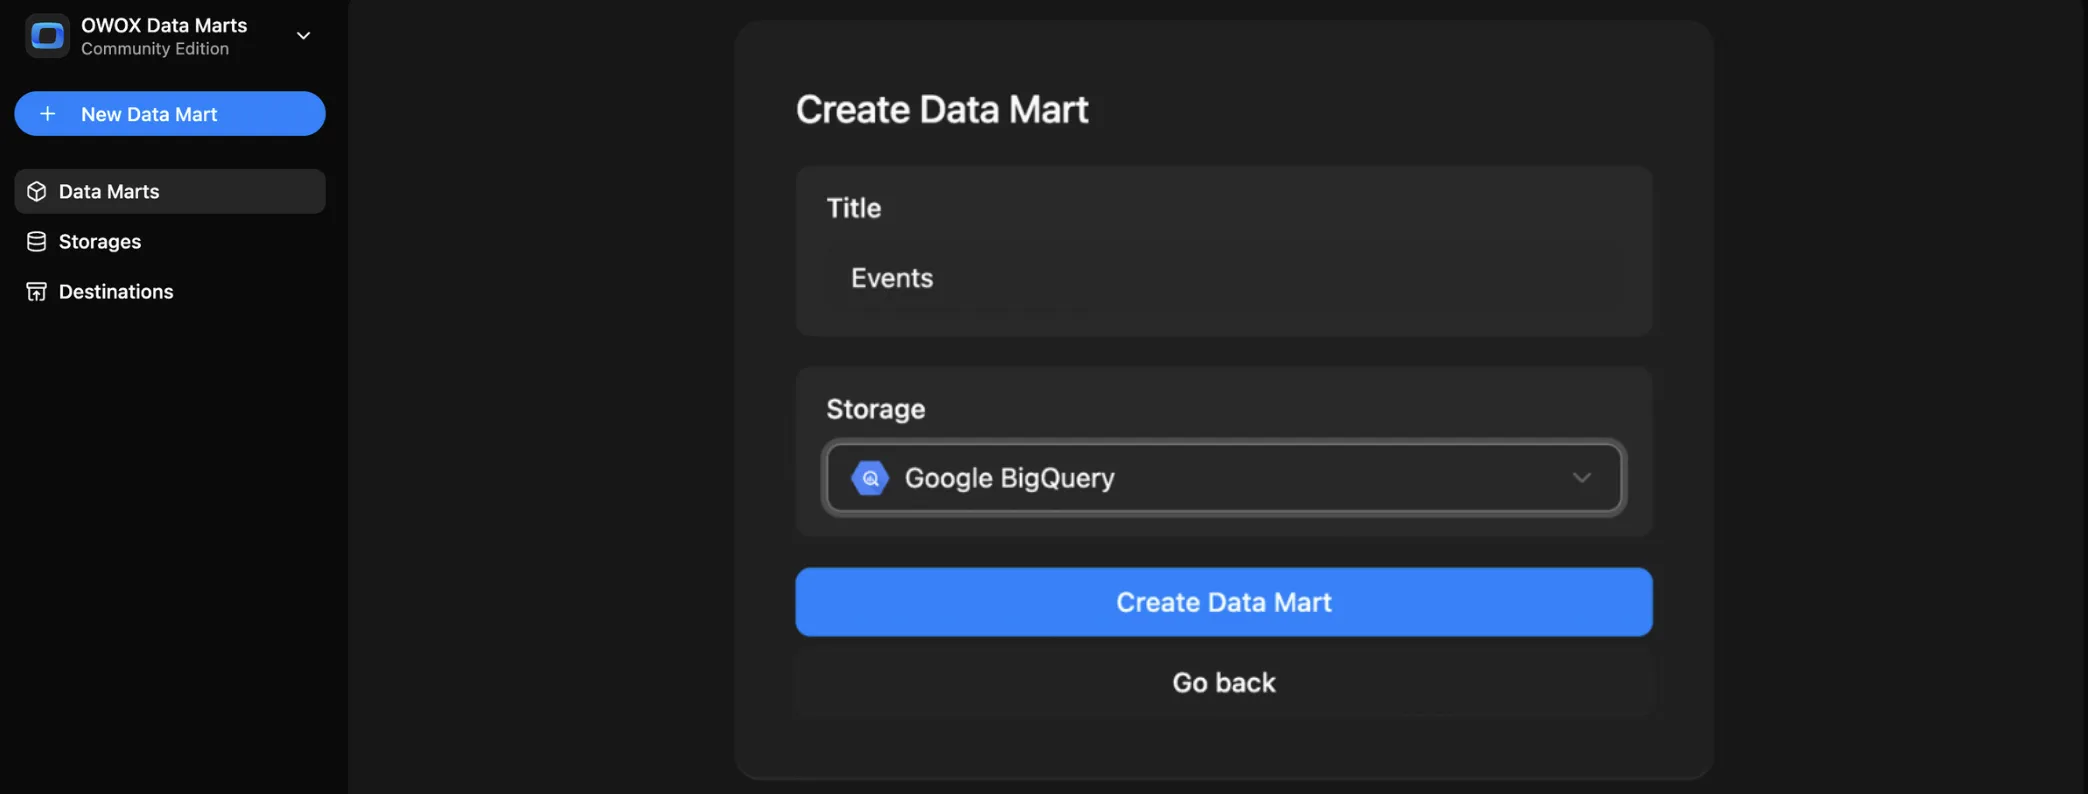
Section titled “Step 1: Create a New Data Mart”- Click + New Data Mart
- Give it a descriptive title, e.g.
Events - Select your Data Storage (BigQuery or Athena)
- Click Create Data Mart
Step 2: Enter Pattern Details
Section titled “Step 2: Enter Pattern Details”In the Input Source section:
- Set Definition Type to
Pattern - Enter a wildcard pattern to match multiple tables, such as:
project.dataset.table_*→ will match all tables starting withtable_
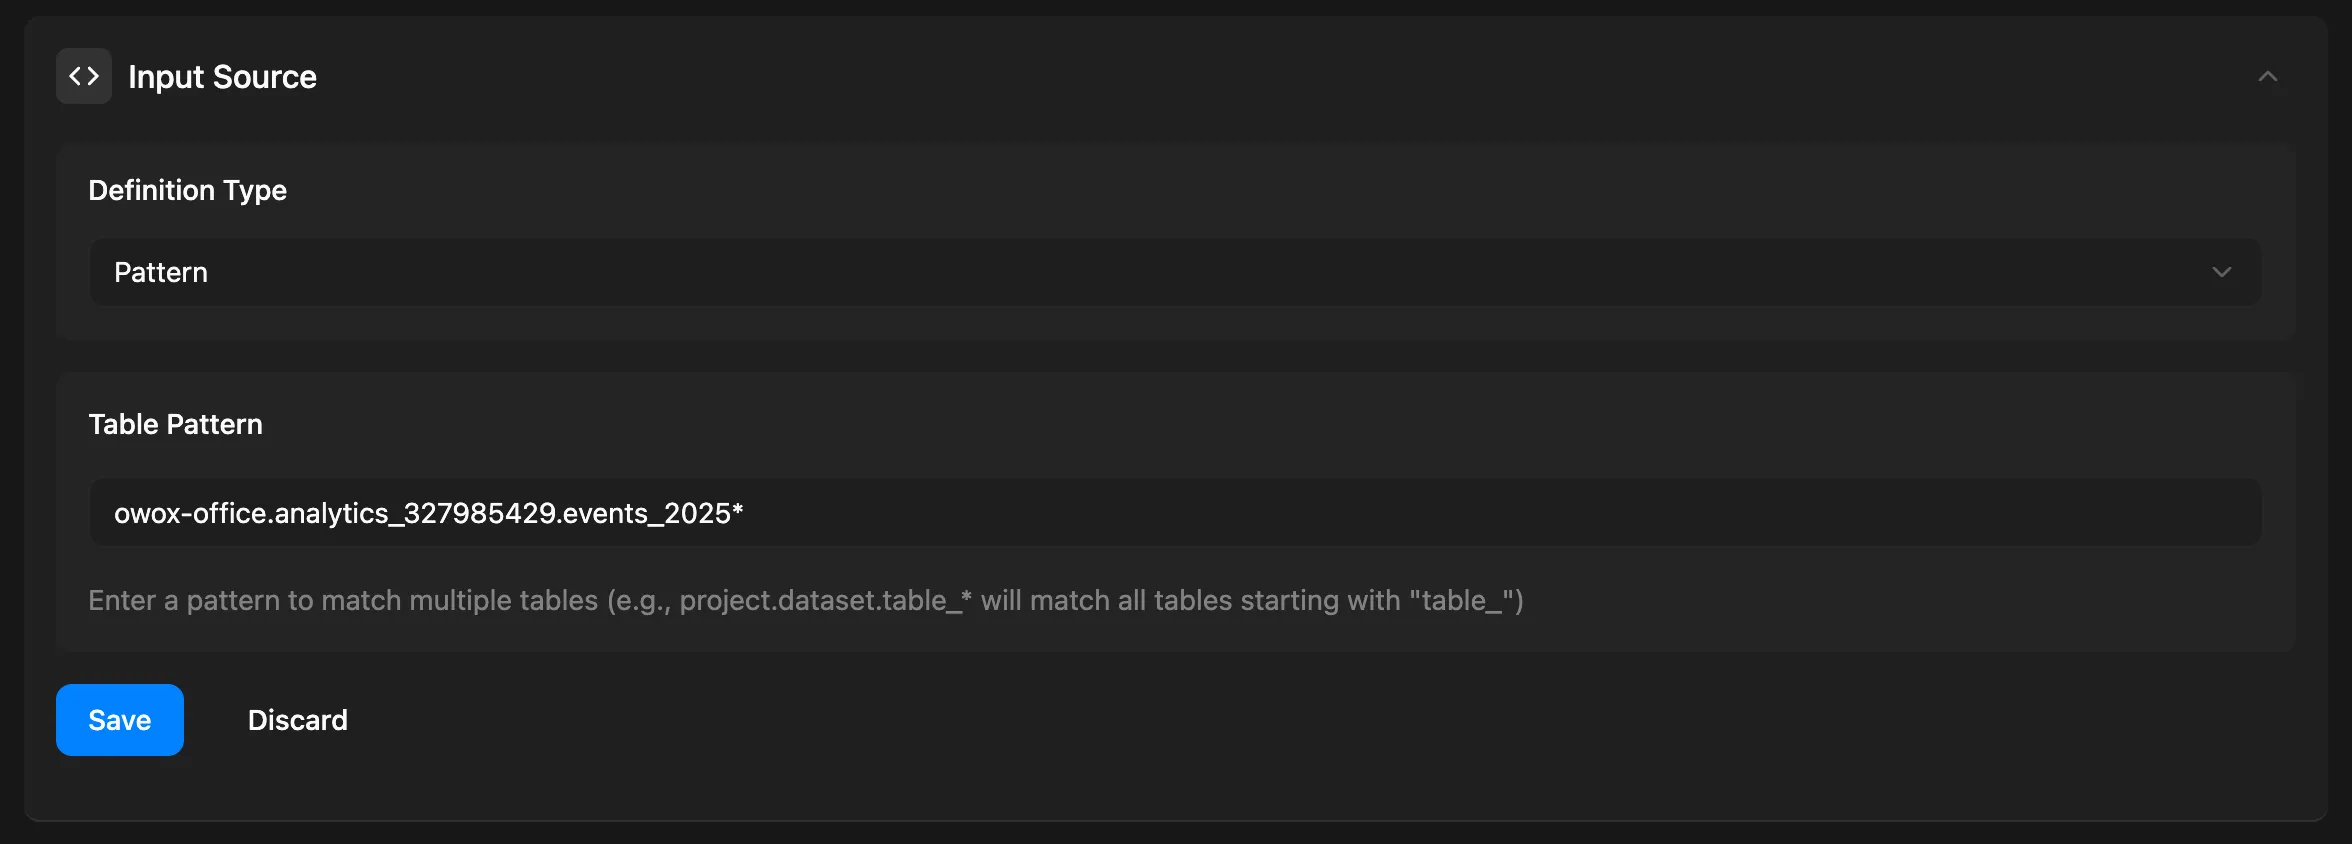
Click Save
Once saved, the Output Schema will be generated automatically with the:
- Field names
- Data types
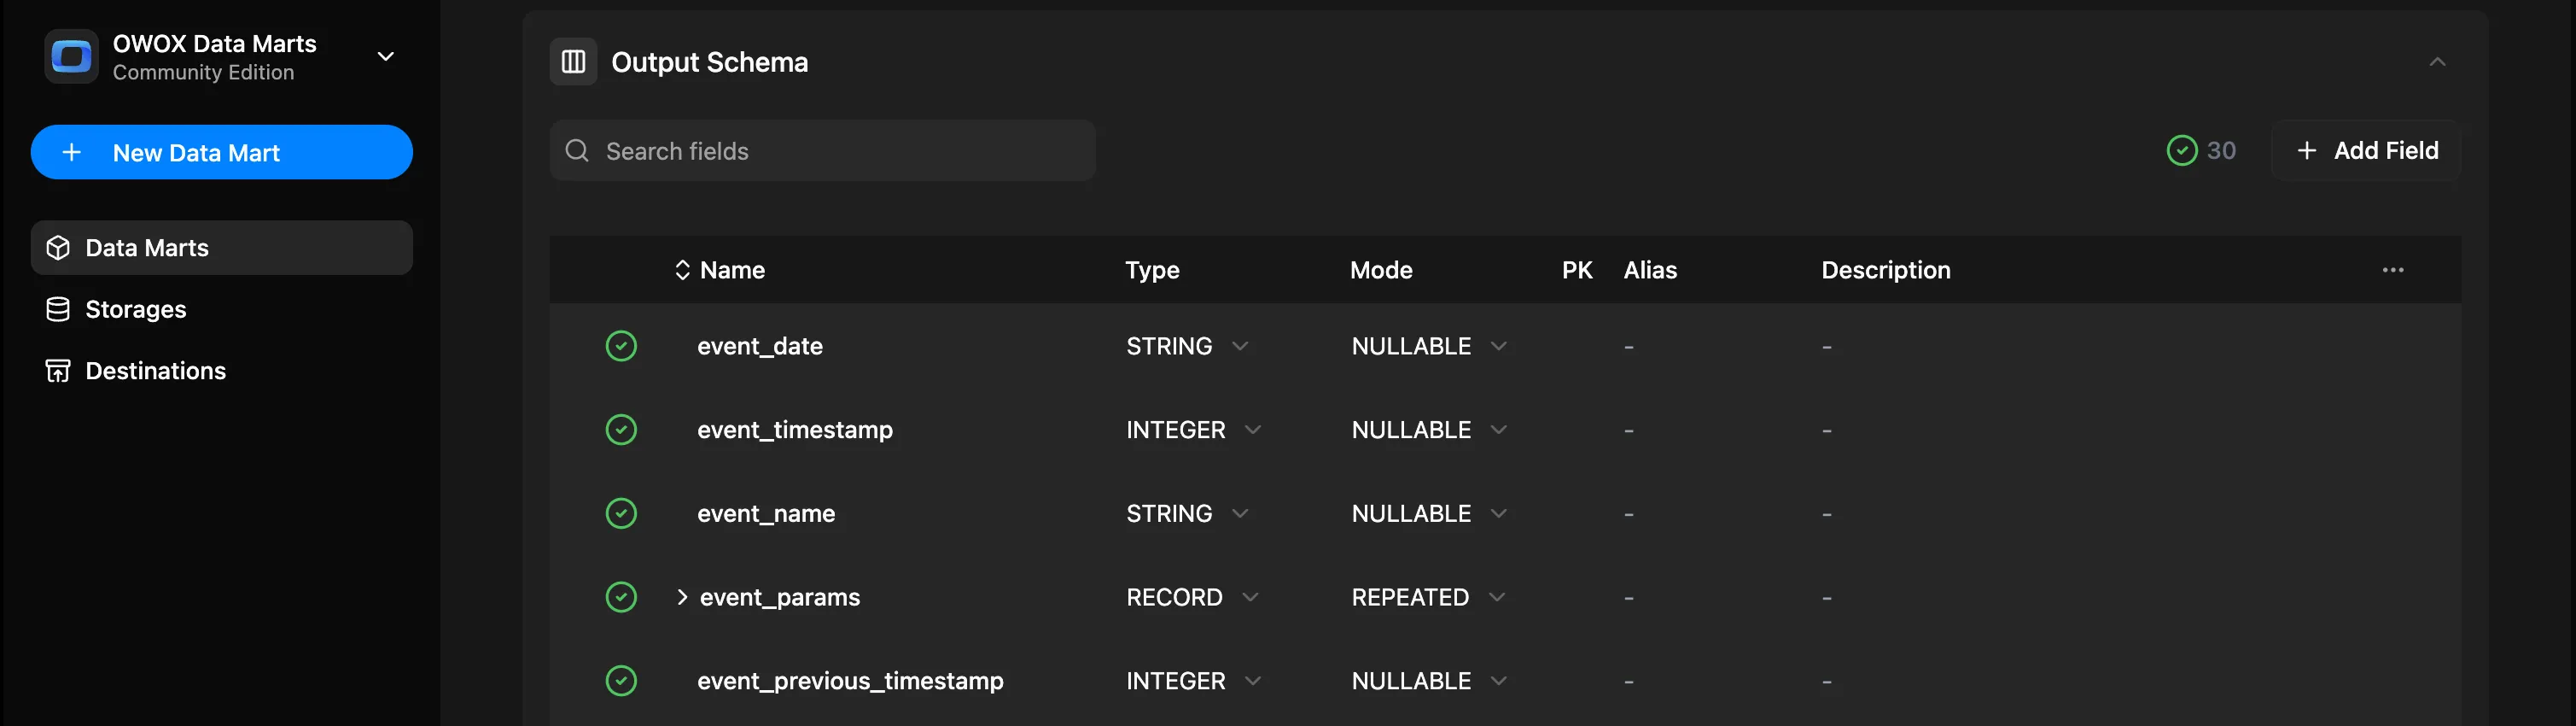
You can now:
- Add aliases (business-friendly names)
- Write descriptions for each field
- Add a description to the Data Mart itself
- Specify join keys
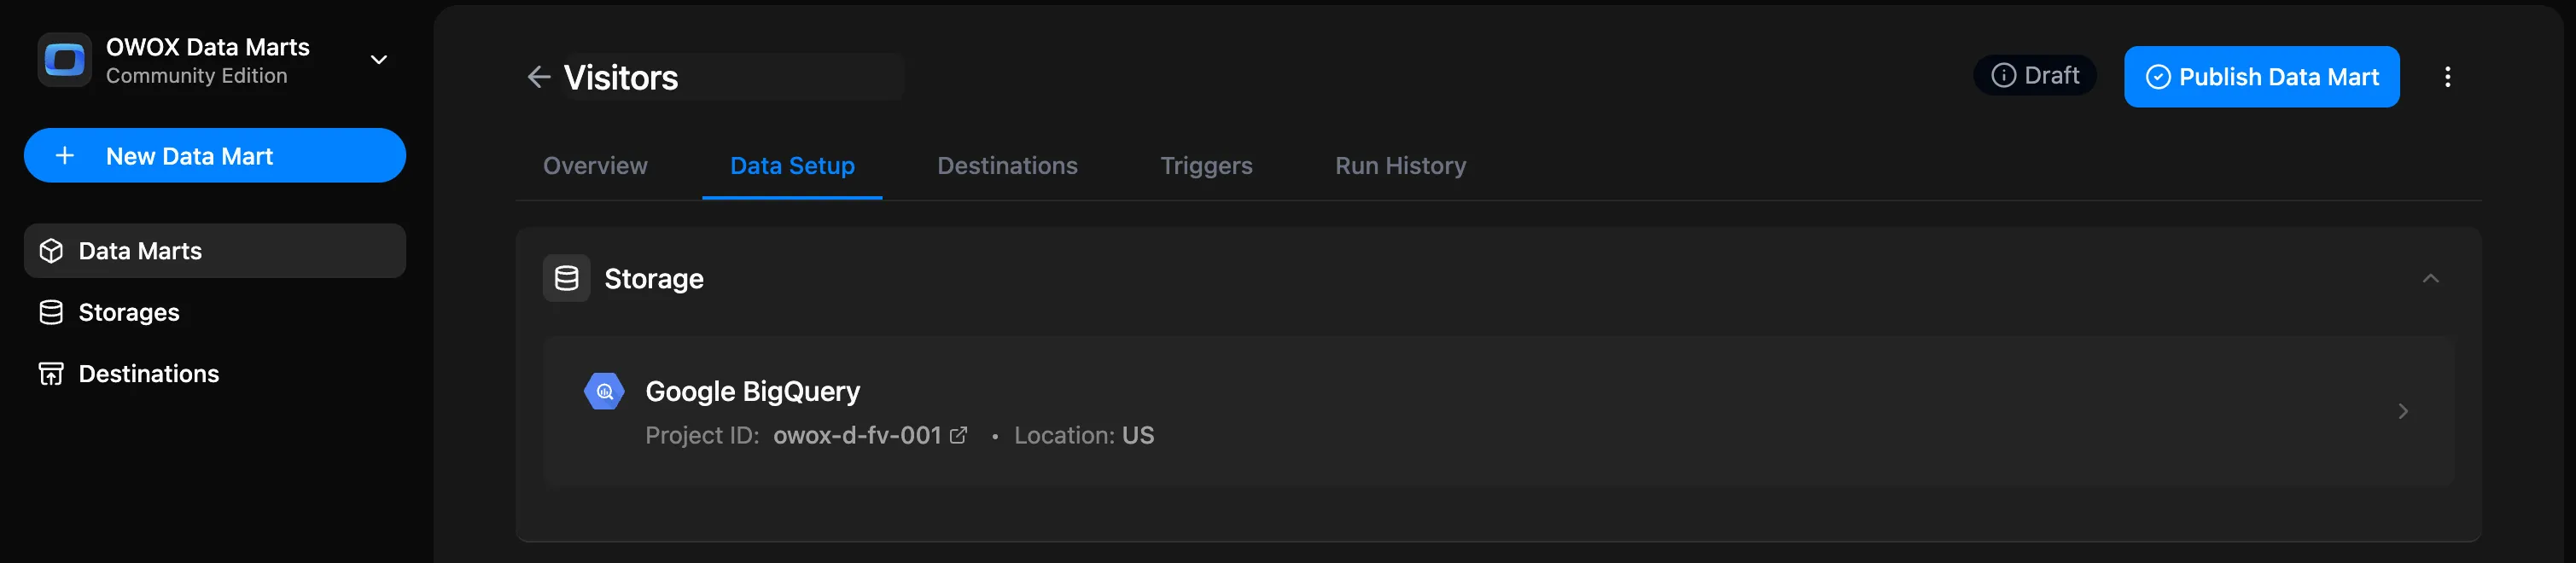
Then click Publish Data Mart
Step 3: Add a Destination
Section titled “Step 3: Add a Destination”You can export the results to:
- Google Sheets → Set up destination, choose refresh schedule, and filters
- Data Studio
- OData for Excel, Power BI, Tableau (coming soon)
Each destination will reuse the same Data Mart — no need to duplicate logic. You can share the same logic across multiple tools.
To do this:
First, make sure your project has a Destination. If it has none, create one under Destinations in the left sidebar — see Adding a New Destination. You can also click Connect Google Sheets on the Data Mart’s empty Destinations tab.
Open the Destinations tab of your Data Mart.
In your Destination’s block, click + New Report.
Then fill in the report form:
- Give your report a name, e.g.,
Website Visitors - Select a destination
- In Document Link with Sheet ID (GID), paste a link to an existing tab. Or click + New Sheet to create a spreadsheet
- For an existing spreadsheet, share it with the email shown under Share document with, and give it Editor access
- Click Create & Run report. To save without running, open the dropdown next to the button and select Create new report
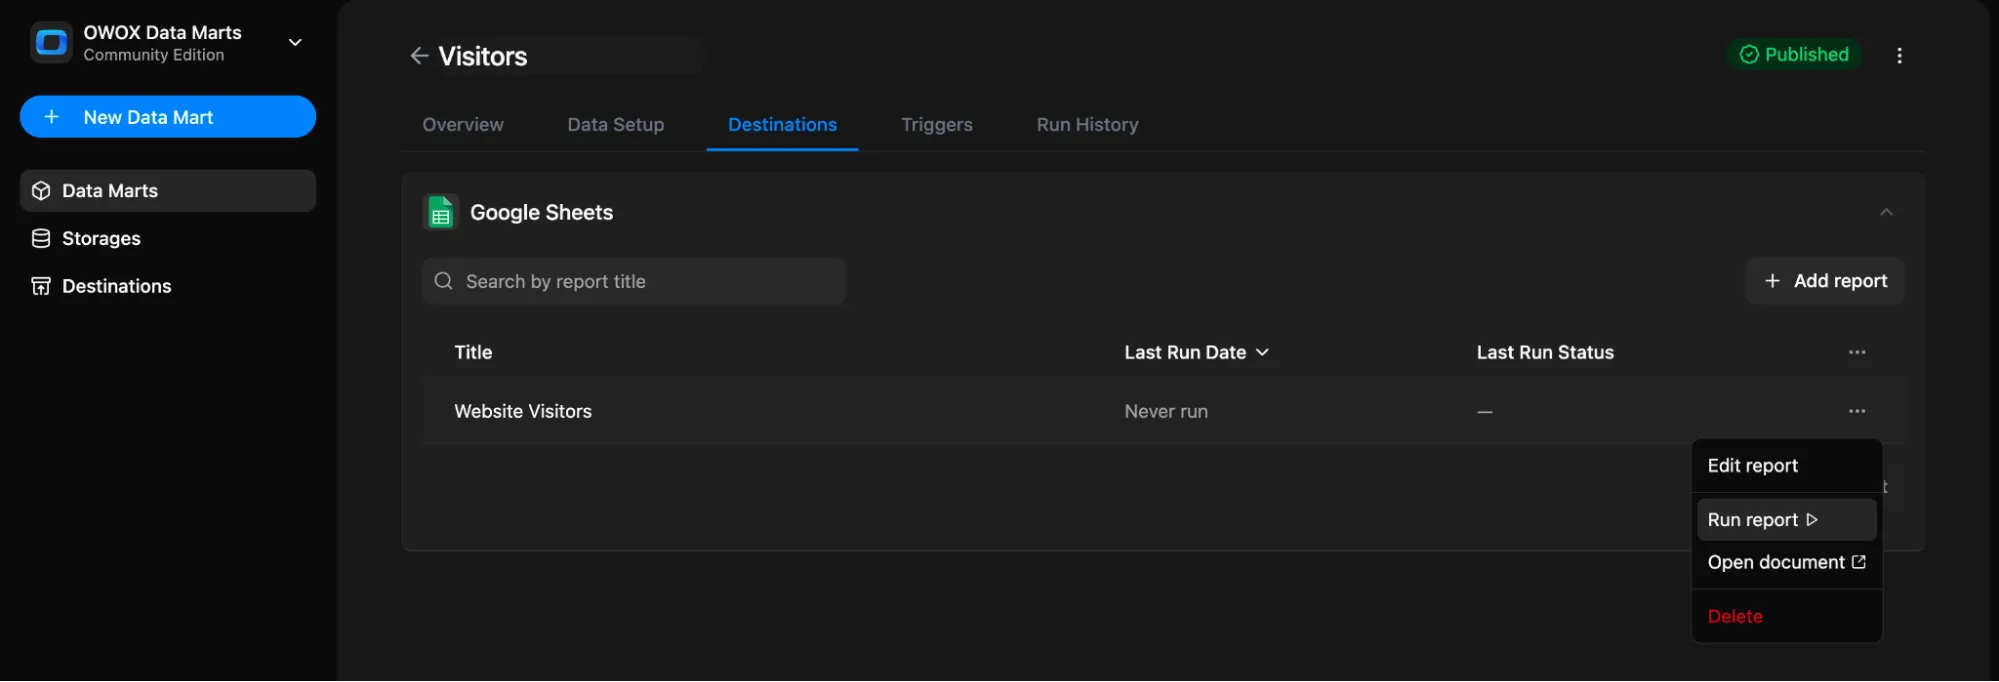
You can now:
- Run report
- Edit report
- Open document
- Delete report
Step 4: Set Triggers
Section titled “Step 4: Set Triggers”You can automate updates by setting a Trigger to refresh the data on a schedule.
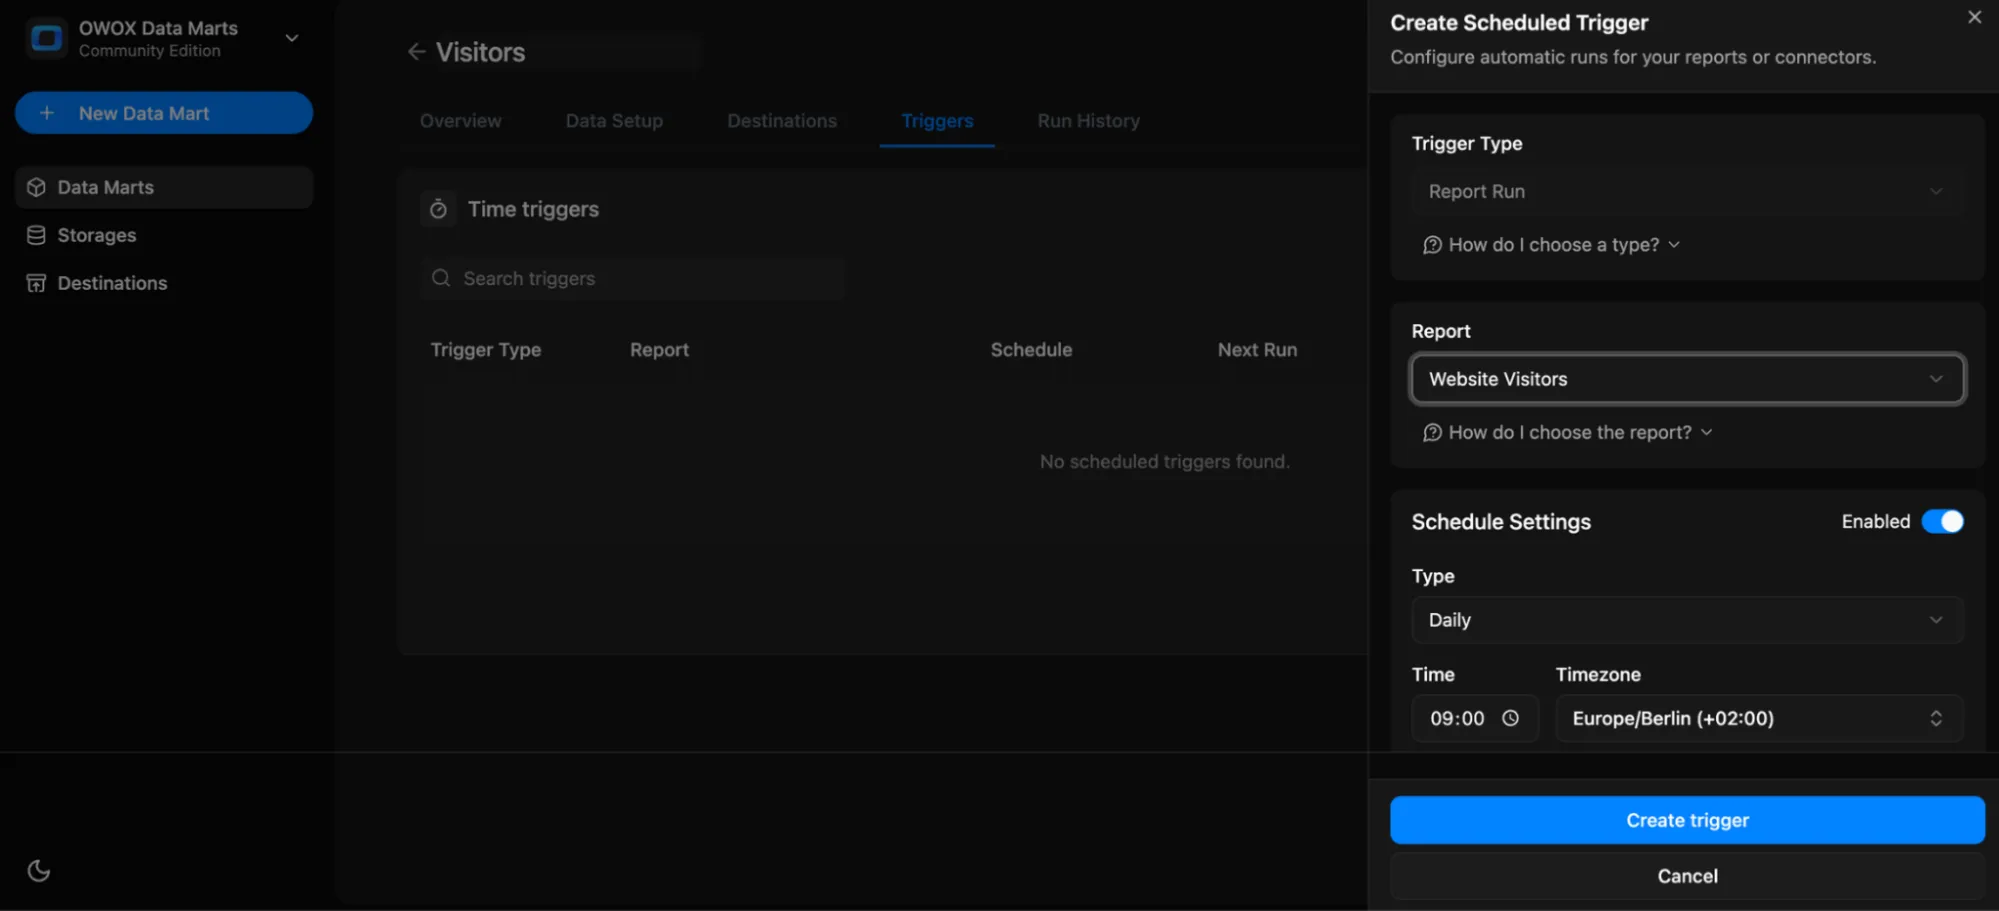
Go to the Triggers tab → Click + Add Trigger
- Choose Trigger Type:
Report Run - Set schedule:
- Daily → Choose time and timezone
- Weekly → Select days of the week, time, and timezone
- Monthly → Select dates, time, and timezone
- Interval → e.g., every 15 minutes
- Click Create trigger
You can also open the Run History tab to view execution logs, status, and timestamps.